Someone published a piece[1] claiming a theme author was inflating his active install counts on WordPress.org. I read it, got annoyed at how plausible it sounded, and decided to check it myself instead of taking anyone’s word for it.
That took a day. What I found is worse than the original accusation, and it has nothing to do with that one author.
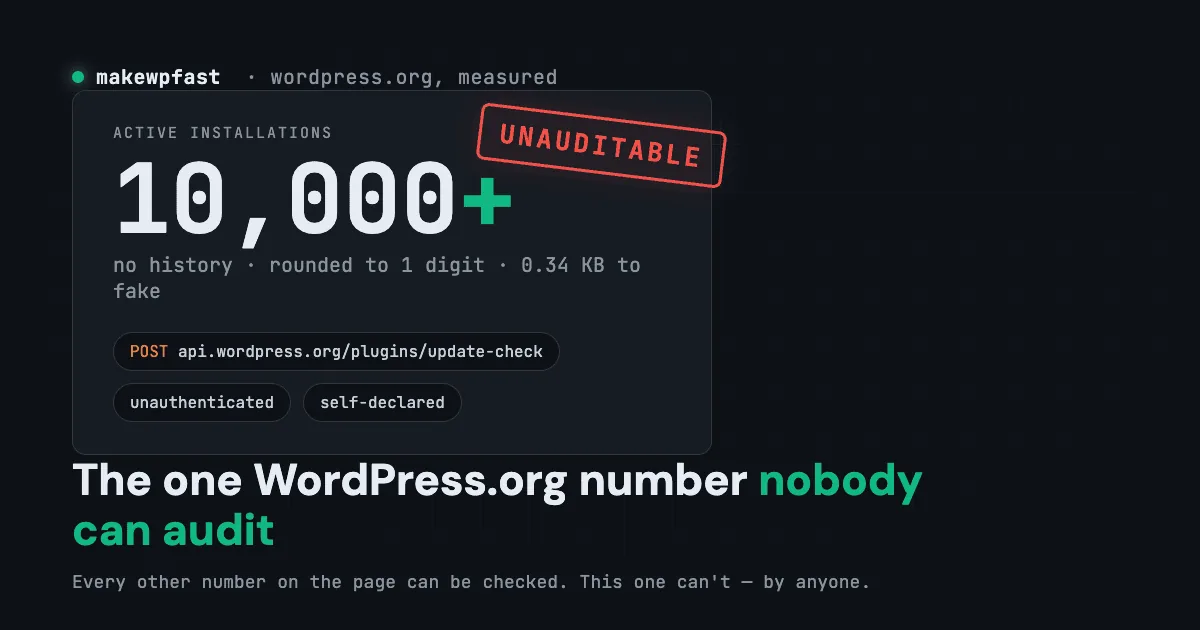
The number in the plugin directory that says “10,000+ active installations” is the softest number in the whole ecosystem. It has no public history, it’s rounded to one significant digit, it costs about a third of a kilobyte to fake, and it drives your position in search. Every other number on that page can be checked by anyone. This one can’t be checked by anybody outside WordPress.org, including the plugin author whose reputation is attached to it.
Here’s the whole thing, measured.
Where the number actually comes from
It’s not telemetry. Nobody sat down and designed an analytics system for WordPress.org. The install count is a byproduct of the update check, and you can read it in core, in wp-includes/update.php:
$to_send = compact( 'plugins', 'active' );
$options = array(
    'body'       => array( 'plugins' => wp_json_encode( $to_send ), ... ),
    'user-agent' => 'WordPress/' . wp_get_wp_version() . '; ' . home_url( '/' ),
);
$url = 'http://api.wordpress.org/plugins/update-check/1.1/';
Four things fall out of those six lines.
The endpoint is unauthenticated. No key, no signature, no challenge. Anyone can POST to it.
The identity of the reporting site is home_url(), stuffed into the User-Agent header. That’s a string the client declares about itself. WordPress.org counts “different URLs logged”, so the unique key is a value the reporter picks.
The payload separates plugins (everything installed) from active (the active_plugins option). An “active installation” means present in the active array. And matching is done on the plugin’s folder name.
It fires on the twicedaily cron plus admin_init and the plugins screen. WP-Cron runs on traffic, so a site with no visitors and no wp-admin logins barely reports at all. That matters later.
Before anyone calls this a WordPress screwup: there can’t be authentication here. Every WordPress on earth has to be able to ask “any updates?” without registering first, and you can’t ship a secret to millions of self-hosted installs and expect it to stay secret. npm, PyPI, Docker Hub and the VS Code marketplace all have the same hole for the same reason. The mistake isn’t the design. The mistake is treating the output as a fact.
The number is bucketed, and I can prove where the buckets are
People assume rounding. I counted it. Across a sample of 5,298 plugins, these are the only active_installs values the API ever returns at the low end:
     0  x4594        40  x40      100  x43
    10  x341         50  x17      200  x22
    20  x110         60  x14      300  x10
    30  x47          70  x10      400  x7
Nothing exists between 0 and 10. 0 doesn’t mean zero, it means “under the reporting floor”, which is why the plugin page shows “Fewer than 10” instead of a number. Above that it’s rounded to the first significant digit, so 398 becomes 400 and “10,000+” is really anywhere from 10,000 to 19,999.
So the published resolution is roughly plus or minus 33%. On a metric with no history.
The asymmetry that made me write this
Downloads and active installs sit next to each other on the same plugin page, and they behave nothing alike.
| Downloads | Active installs | |
|---|---|---|
| Public history | ~730 days, day by day | none |
| Resolution | exact count | bucket, ~33% wide |
| Retroactive check | anyone can do it | nobody outside wp.org can |
| Visibility in the directory | buried | front and center, feeds ranking |
Now the cost side. I measured what you’d have to transmit to move each number by one unit:
| Attack | What you send | Size |
|---|---|---|
| +1 download (elementor) | the whole zip | 23,202 KB |
| +1 download (woocommerce) | the whole zip | 20,064 KB |
| +1 download (contact-form-7) | the whole zip | 290 KB |
| +1 active install | one update-check POST | 0.34 KB |
For a big plugin that’s a factor of about 60,000.
The cheap metric is the unauditable one, and it’s the one that drives ranking. That combination is the actual problem.
Which way the data actually leans
If downloads were the soft target, you’d expect to find plugins with mountains of downloads and no installs. I checked. Sample of 2,500 popular plugins, all with 1,000+ active installs, ratio of lifetime downloads to active installs:
| Band | Count | Share |
|---|---|---|
| < 1.00 (more actives than downloads ever) | 10 | 0.4% |
| 1.00-2.99 (suspiciously tight) | 22 | 0.9% |
| 3.00-9.99 | 278 | 11.1% |
| >= 10 (normal) | 2,190 | 87.6% |
Median 29.1. Fifth percentile 6.8. Plugins with a ratio above 500, meaning huge downloads and almost no installs: zero out of 2,500. Not one.
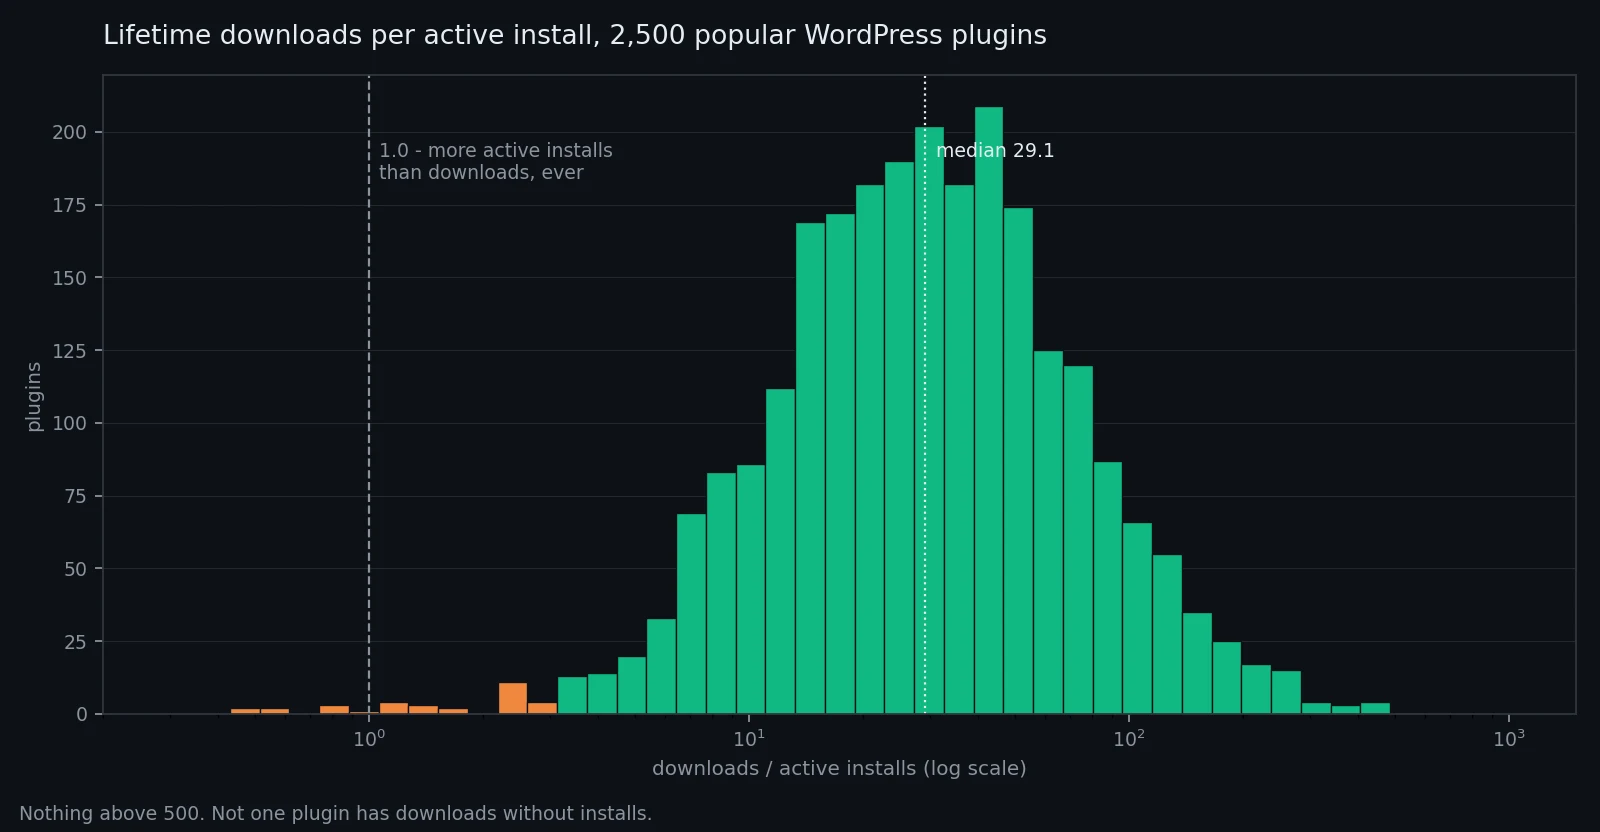
The whole distribution sits to the right of 1.0 and stops well short of 500. If downloads were the metric being gamed, that right tail would exist. It doesn’t.
So the distortion, wherever it exists, runs in one direction only.
The part where I was wrong
My first pass treated dl/active < 1 as a fraud signal. It isn’t, and I had to correct myself before I embarrassed myself in public. Here’s the actual sub-1.0 list from that sample:
| Plugin | Active | Downloads | dl/active | Explanation |
|---|---|---|---|---|
| hostinger-reach | 1,000,000 | 516,253 | 0.52 | auto-installed by the host |
| page-optimize | 200,000 | 92,776 | 0.46 | Automattic / Jetpack |
| gravatar-enhanced | 100,000 | 47,590 | 0.48 | Automattic |
| crowdsignal-forms | 200,000 | 171,868 | 0.86 | Automattic |
| layout-grid | 200,000 | 197,095 | 0.99 | Automattic |
| erecht24 | 50,000 | 29,816 | 0.60 | bundled by German hosts |
| (a 57-day-old plugin) | 80,000 | 61,144 | 0.76 | no known deal, unexplained |
Six of the seven have a boring answer. Host bundling, platform pushes, site cloning: all of them install a plugin without a wp.org download, and all of them produce the identical signature.
The only honest reading of a sub-1.0 ratio is “these installs did not arrive via a wp.org download”. That set includes fabricated telemetry, but it also includes most of the legitimate distribution channels in this ecosystem. If you publish it as an accusation you will be wrong most of the time.
Which brings me to the thing I actually want people to take away from this.
You can inflate a plugin you don’t own
Go back to those six lines of core. The endpoint takes a self-declared site URL and a self-declared plugin folder name. Neither is verified, and neither has anything to do with who wrote the plugin.
So nothing stops you from reporting somebody else’s slug. Pick a competitor, report their plugin as active on a few thousand invented URLs, and their number climbs.
Now stack that on top of the audit asymmetry:
Evidence that something is anomalous is public. Anyone can pull the download series and the install bucket and compute the gap. I just did it for 2,500 plugins in an afternoon.
Evidence of who caused it is private. The reporting source is visible only to WordPress.org. The author can’t see it. You can’t see it. It never becomes public even when the platform acts on it.
The accusation is free and the rebuttal is impossible. The plugin author is the single party who can’t control who reports their slug, and the single party with no data to clear their name.
Worse, the victim has no reason to notice. Getting inflated makes your numbers go up and your ranking improve. The damage arrives later, when the platform detects the cluster and purges it, and your count drops from 30,000 to 4,000 overnight in full public view. From the outside that reset looks exactly like a confession. The wp.md data shows four accounts resetting on the same day, 27 May 2026.
If you’re about to accuse a plugin author of buying installs based on a download-to-install ratio, understand that the same signature is produced by someone attacking them, and that you have no way to tell the two apart. Neither do I.
What I could and couldn’t confirm about the original claim
Since I started here, the results on the theme in question. Three checks:
The claim that a readme-only update produced roughly 1,400 downloads. Peak single day in the download series: 1,398. That one is exact.
Lifetime downloads per active install: 129,284 / 30,000 = 4.3. That’s the lowest of the 14 themes I compared, where the floor for the healthy ones is 11.5. Its own stablemates sit at 64.5, 162.9 and 274.3, so it isn’t an author-wide measurement artifact.
Update capture rate, meaning downloads in the 14-day window around a release minus the quiet baseline, expressed as a share of the claimed fleet: 7.6%, against 14-105% for its peers. A real fleet has to download the update. A fabricated one can’t.
All three are consistent with the accusation and none of them proves it. Bucketing, auto-update opt-out rates and version counts all add noise.
And the central claim, the week-over-week jumps and the resets, is not verifiable by anyone. WordPress.org publishes only the current bucketed number. There is no history endpoint. Nobody outside the platform can check “+6,000 in a week”, retroactively, ever.
So I started recording it
That’s the whole reason the tooling exists. The history can’t be recovered. It can only be started.
snapshot.py appends one JSON line per slug per day to data/snapshots.jsonl, idempotent per calendar day, running off launchd at 09:20. It records active installs, lifetime downloads, current version, last-updated, and the last 8 days of daily downloads. Boring on purpose. In a month it’s a dataset nobody else has.
./snapshot.py            # snapshot everything in watchlist.txt
./snapshot.py --report   # deltas since the first snapshot, with flags
The signal --report computes is dl/new: downloads gained per new active install, between two snapshots.
if da > 0:
    # Every genuine new install had to download the zip at least once,
    # so a ratio below 1.0 cannot be explained by real adoption.
    ratio = dd / da
    if ratio < 1.0:
        flag = "IMPOSSIBLE: installs outran downloads"
elif da < 0 and abs(da) >= 0.2 * (prev["active_installs"] or 1):
    flag = "large drop - possible wp.org purge"
Because active installs are bucketed, dl/new is only computable when a plugin crosses a bucket boundary. That sounds like a limitation and isn’t much of one, since bucket transitions are exactly the events worth auditing. The 4,000 to 30,000 jumps are the whole question.
The rest of the scripts do one thing each. spike.py is the update capture rate described above and it’s the most useful of them. lifetime.py sorts lifetime downloads per active install. audit.py puts active installs next to total, median and peak downloads. age.py normalizes for how old the plugin is and how many releases it’s had.
Every --report run ends with this, printed unconditionally:
ATTRIBUTION WARNING: a flag says installs did not arrive via wp.org downloads. It does
NOT say who caused it. Host bundling, platform pushes and site cloning all look the same,
and anyone can inflate a plugin they do not own. Nothing here identifies the author as
the actor - only wp.org sees the source of the reports. Never publish a flag as an
accusation.
I put it in the output rather than the README because a README is something you read once and a flag is something you act on. Given what I explained above about attacking a competitor’s slug, a tool that flags without that warning is a weapon.
Two things that cost me debugging time
The stats API path is plural for themes and singular for plugins:
https://api.wordpress.org/stats/themes/1.0/downloads.php   # themes
https://api.wordpress.org/stats/plugin/1.0/downloads.php   # plugins, not "plugins"
stats/plugins/ returns a 404 and no hint about why.
The other one bit me on a live site. With an object cache running, wp option get _site_transient_update_plugins returns a dead row straight out of the database while the live value sits in Redis. On one site the gap was eight months: database said 2025-11-25, cache said 2026-07-22. I nearly concluded that the site hadn’t checked for updates since November. Use wp transient get update_plugins --network instead.
Do it yourself
Both endpoints are public and unauthenticated. Swap in any slug:
# current active_installs (bucketed) + lifetime downloads
curl -s "https://api.wordpress.org/plugins/info/1.2/?action=plugin_information\
&request[slug]=SLUG&request[fields][active_installs]=1&request[fields][downloaded]=1"

# daily downloads, up to ~730 days back
curl -s "https://api.wordpress.org/stats/plugin/1.0/downloads.php?slug=SLUG&limit=730"
That’s about ten seconds of work and it’s more verification than most people do before picking a plugin.
Why I care about this
I benchmark plugins for a living. There are 63,000+ of them measured on this site, every one on a real WordPress install, activation cost and homepage cost and admin cost, because I don’t trust anybody’s claim about their own plugin’s performance. It’s the same reason I built a speed badge that reports the measured millisecond cost instead of a marketing grade. Same instinct applies here.
“10,000+ active installations” is a claim, routed through an unauthenticated endpoint, rounded, published with no history. Treat it as directional at best. Two of them next to each other tell you which is bigger. Neither of them tells you what you think it tells you.
The install history starts existing the day someone starts writing it down. I started on 22 July 2026. If you want a series for a specific slug, ask and I’ll add it to the watchlist.
[1] Fake WordPress theme installs on wp.md — the post that inspired this one. ↩
Join developers and agency owners who get backend optimization strategies, tool releases, and deep-dive guides.
No spam. Unsubscribe anytime. I respect your privacy.