I run a benchmark that measures what a WordPress plugin actually costs you. Memory, queries, time to first byte, measured in three contexts: activating it, loading the homepage, loading wp-admin.
For a while every plugin page had a badge you could embed. It showed a letter grade. A, B, C, down to F.
Today I checked how many people had embedded it. The answer is zero. Across 25,242 requests to the badge endpoint, not one came from another site. Every request came from my own pages or carried no referrer at all, and that’s every request in the logs I still have.
So I went looking for why.
The grade was meaningless
Here’s the grade distribution across the 57,948 plugins I’ve given a grade to:
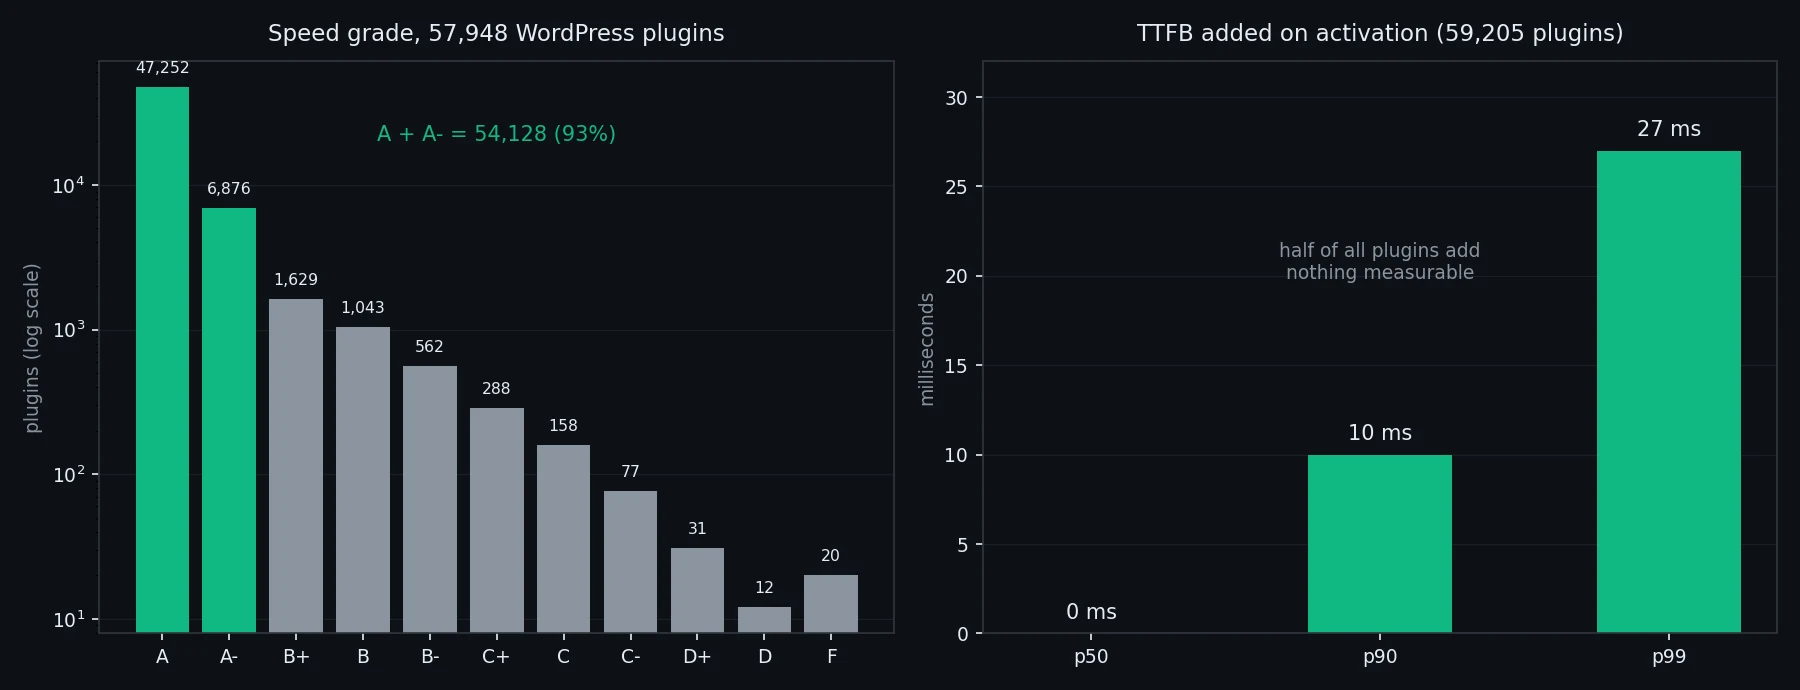
47,252 score an A. Another 6,876 score an A-. That’s 54,128, or 93% of every plugin I’ve graded.
Twelve plugins have a D. Twenty have an F.
My first thought was that my grading curve was broken. It isn’t. Look at the right half of that chart. On activation, the median plugin adds 0ms. p90 is 10ms. You have to get to p99 before you hit 27ms.
Most WordPress plugins genuinely cost nothing measurable. I found the same thing on the homepage when I benchmarked the plugin count myth, where the median plugin also added 0ms. The curve is accurate. Most plugins really are that cheap.
Why the numbers on this site don’t match
Quick detour, because you’ll spot three different counts if you look around.
There are 63,516 plugin pages on the site, one per plugin on wordpress.org. That’s the number in my footer. 57,948 of them have a grade. So 5,568 plugins have a page and no grade, and it’s worth saying out loud why.
It’s mostly my fault. 3,643 of them, about 65%, are marked “stuck after N loop attempts”, which means my benchmark rig hung while testing them and gave up. That’s my harness, not the plugin. Another 1,135 have no reason recorded at all, so they’re sitting in the queue or were never attempted.
738 are the plugin’s own doing: a PHP fatal on activation, a crash, a white screen, files with broken encoding. 52 need WooCommerce or Elementor or a newer WordPress than my sandbox runs, so I can’t measure them in isolation.
So of the plugins I can’t grade, 13% are broken plugins and the rest are my problem. If you see “N/A” on a page, that’s the most likely story. I’d rather show N/A than guess a number.
So the badge was handing out an A to almost everyone. There’s no brag in a grade that 93% of plugins share. Nobody puts a participation trophy in their README, and the logs agree.
The obvious fix doesn’t work
The obvious answer is to rank them. Stop giving out letters, start giving out positions. “Top 5% fastest.” “#3 of 412 in caching.” Scarcity makes a badge worth showing.
I can’t do that honestly.
Go back to the median. On activation, the middle plugin measures 0ms, and most of the distribution sits down there with it. If #1 through #300 in a category all add nothing measurable, then “#3 fastest of 412” is me ranking measurement noise and dressing it up as precision. The numbers would look authoritative and mean nothing. I’d be inventing a hierarchy the data doesn’t contain.
There is a real ranking available at the slow end. The tail is genuinely spread out, and I could tell you which plugins are in the slowest 5%. But nobody would ever embed that.
That’s where I got stuck for a bit. There’s no distinction in the data to put on a badge.
What the badge does now
So the badge states a measurement now:
MakeWPFast: 10ms homepage impact
That’s Akismet. It’s a real number, measured on my rig, and you can check it. Contact Form 7 reads 2ms. Kadence, which is a theme, reads 13ms.
The value is that somebody other than the author measured it and published the method. Plugin authors get told their plugin is slow constantly, usually by someone who never measured anything. A number from a third party answers that.
The badge is a live SVG. It’s one endpoint:
https://makewpfast.com/wp-json/mwf-pseo/v1/badge/akismet
It reads current benchmark data when it’s asked, so it stays right on its own. If a release makes a plugin faster, the badge follows. If a release makes it slower, the badge follows that too. It’s cached at the edge for a day, so a change shows up within 24 hours rather than instantly. I put that on the embed box, because it’s the first thing I’d want to know before putting someone else’s image on my README.
There are three styles if you want something narrower:
/badge/akismet               → 10ms homepage impact
/badge/akismet?style=score   → A
/badge/akismet?style=impact  → Low Impact
An unknown slug returns “Not Found”. An ungraded plugin returns “N/A” rather than a fake letter.
The part I got wrong
TTFB is not part of the grade. The score comes from memory and queries only. So “A · Low Impact” has always meant low memory and query overhead. It says nothing about load time. There was a comment in my own code claiming the composite included TTFB. It didn’t. I fixed the comment today.
That matters for the new badge, because the millisecond number and the letter grade measure different things. If I showed the ms figure on every plugin, a plugin with heavy memory use and 0ms of TTFB could advertise “0ms impact” and look harmless.
So the ms claim only shows up when the composite grade is clean too. I checked the overlap before deciding: 35 plugins read A or A- on the homepage while their composite sits at C+ or C. None are D or F. Those 35 keep the letter grade on their badge, and they don’t get an embed box.
That’s the rule everywhere. If your plugin isn’t in the clean set, the badge still works and still shows your grade, I just don’t offer you the copy-paste box. Asking you to advertise “High Impact” on your own README would be a stupid thing to do.
Query counts are still on my list
Queries are half of what the grade is built from, and I have an open bug where query deltas came back identical across three different contexts. That isn’t plausible, so I don’t fully trust that half of the input yet. It’s why the badge’s headline claim sits on the thing I measure directly.
Auditing that is the next job. Until it’s done, the letter grade is the softer number on the page and the milliseconds are the harder one, which is the opposite of how I built it.
The methodology is written up here if you want to see the rig. The full dataset sits behind the API: 59,205 plugins with activation benchmark data as I write this, and the number goes up most days.
If you maintain a plugin, look it up and grab the badge. If you think the number is wrong, tell me. I’d rather find out the rig is wrong than have nobody check it.
Join developers and agency owners who get backend optimization strategies, tool releases, and deep-dive guides.
No spam. Unsubscribe anytime. I respect your privacy.