After I published the post about whether too many plugins slow WordPress down, a Redditor called my bluff. The benchmark data says the median plugin adds 0ms to your homepage – fine. So install as many of those “fast” plugins as you can on one box and prove the count doesn’t matter.
Ok. Challenge accepted. I took a fresh WordPress install on a deliberately miserable box – 256 MB PHP memory limit, 1 vCPU, no page caching at all – and started stacking the fastest, most popular plugins from my benchmark database until something broke. I wanted a real number for how many plugins WordPress can actually handle before it falls over.
I got to 223 active plugins. The homepage was still serving HTTP 200. And almost everything I believed going in turned out to be half wrong – including my first reading of how my own optimizer plugin behaved on the pile.
This got long, so here’s the map: the climb to 223, the one plugin that took the whole site down, what an optimizer plugin can and can’t do here, the hunt for the worst offenders, and the fix that actually worked.
The setup
- Fresh WordPress 7.0 in an isolated Docker container
- PHP
memory_limit = 256M– a hard wall, on purpose - 1 vCPU, no page cache, no object cache – every request fully dynamic
- Candidate pool: 5,202 plugins from the benchmark DB that are both fast (≤2ms activation TTFB delta) and popular (≥1,000 installs)
The exclusions matter for honesty. I dropped all caching plugins (one LiteSpeed Cache would turn every measurement into a cache hit and the test would be meaningless), plus maintenance pages, login changers, redirects, firewalls, SSL forcers and 2FA – anything that would break the measuring itself rather than slow the site. I also added a 15 MB disk-size cutoff to honor “smallest”. Fair warning: the exclusion list wasn’t this clean on day one – it tightened during the run, every time something bit me. More on that below.
Then: install in batches, activate, measure. Peak RAM per request, PHP files loaded, DB queries, TTFB. Repeat until the box gives up.
The climb to 223
| Active plugins | Peak RAM | Files loaded | DB queries | TTFB |
|---|---|---|---|---|
| 0 | 6 MB | 480 | 25 | 0.32 s |
| 30 | 10 MB | 1,403 | 107 | 0.55 s |
| 60 | 12 MB | 1,996 | 173 | 0.50 s |
| 100 | 16 MB | 3,255 | 260 | 1.12 s |
| 150 | 42 MB | 4,225 | 420 | 1.20 s |
| 191 | 74 MB | 4,929 | 498 | ~2.7 s |
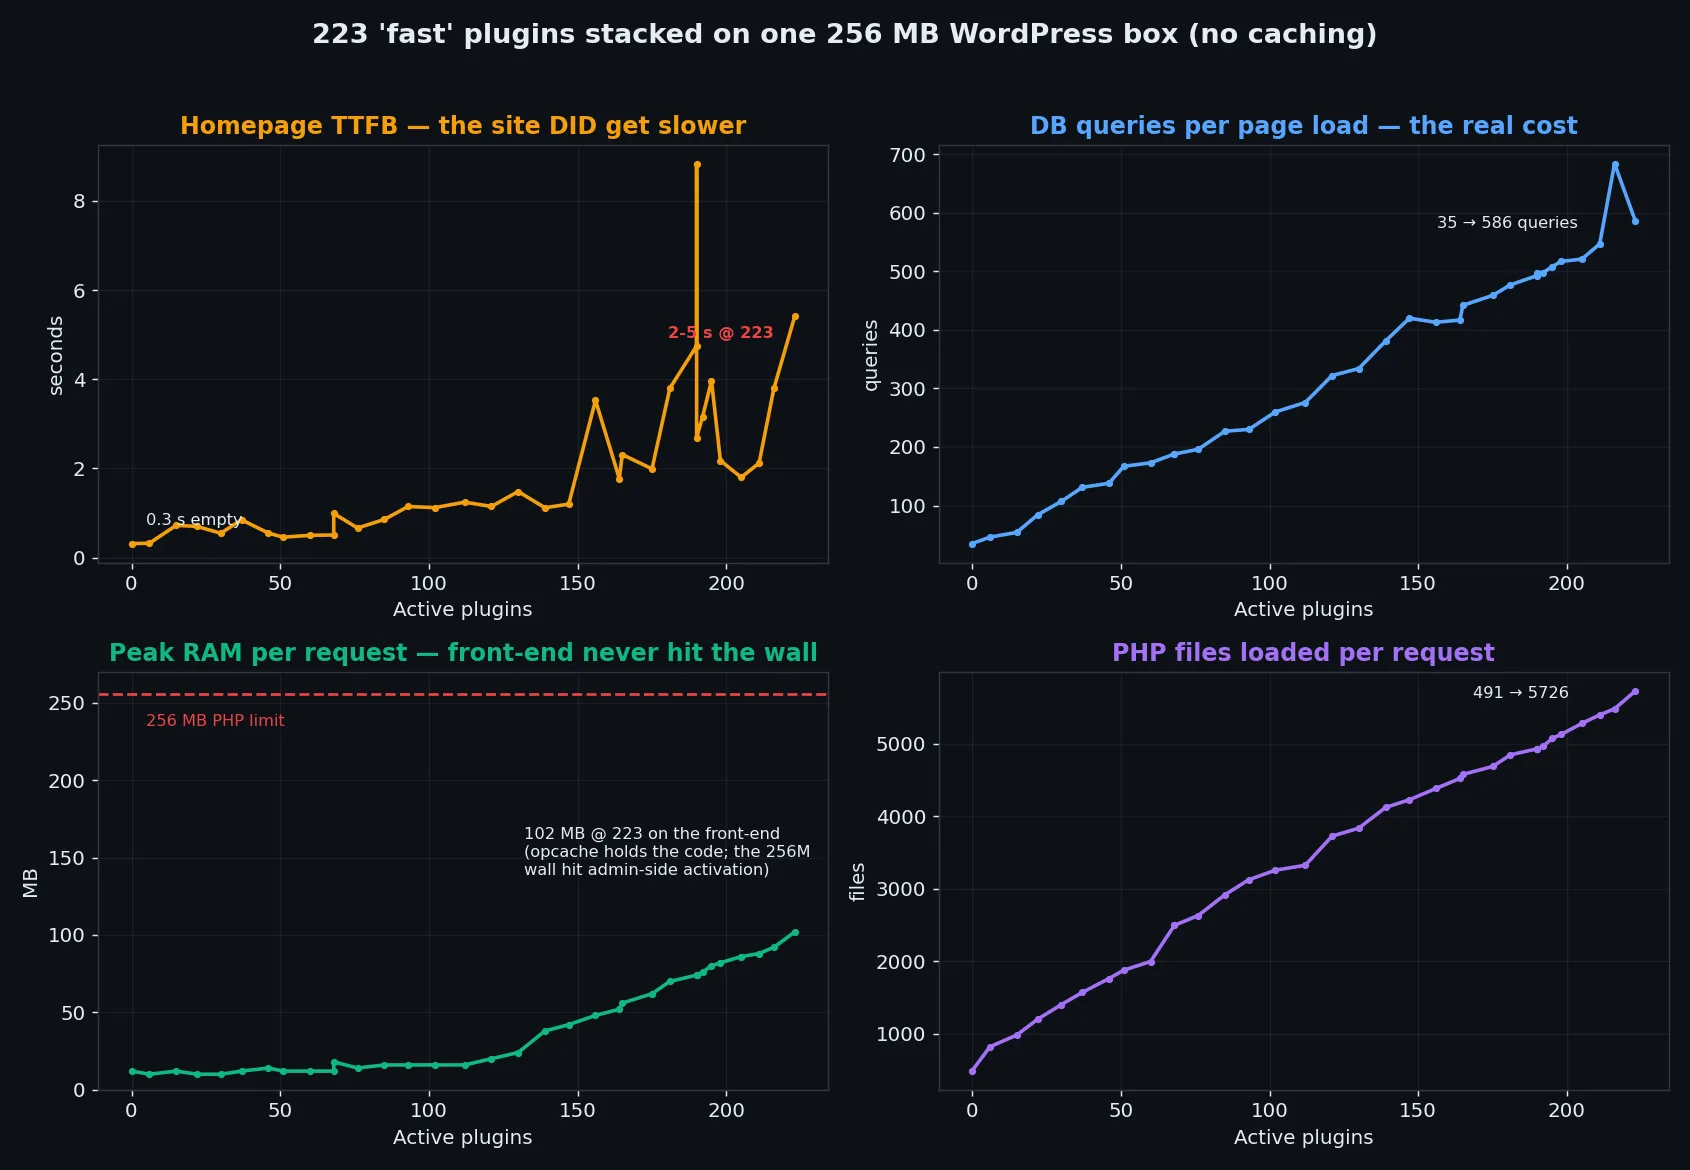
| 223 | 102 MB | 5,726 | ~586 | 2-5 s |
Three things jumped out.
The count doesn’t eat your RAM
The fear everyone repeats is “200 plugins will blow your memory”. On a box with OPcache, the front-end barely notices. Peak per-request memory went from 6 MB empty to 102 MB at 223 plugins – around 40% of the 256 MB wall, with the homepage still rendering fine.
The reason is OPcache. It holds the compiled plugin code in shared memory, outside the per-request budget. The plugin folder grew to 784 MB on disk and the rendered page didn’t care.
The 256 MB wall is real – but it lives in wp-admin
The memory limit did eventually bite. Just not where I expected. The homepage kept serving at 223 plugins. What died was the admin bootstrap: activating plugin #224 means loading all 223 existing plugins in admin context, which does far more work than a front-end render, and that blew straight through 256 MB. Later in the experiment wp-login.php itself stopped responding.
So on a memory-starved box the ceiling never touched the visitors. It locked me out instead – no login, no plugin management, no admin at all.
But the site absolutely got slower
Here’s where the Redditor is only half right. Every active plugin registers hooks and runs queries on every page load, and that scales nearly linearly: queries went 25 → ~586 (23x), files loaded per request 480 → 5,726 (12x), and uncached TTFB from 0.3s to several seconds.
The damage comes from the per-request work each active plugin adds, and it accumulates with every install. With page caching most of this disappears on a cache hit – which is exactly why I’d rather measure what each plugin costs than argue about counts. The articles claiming there’s no fixed plugin limit are right about that part. They just never put a number on the accumulation, and the number is what makes it click.
Tired of guessing which plugins are slowing your site down? That’s why I built WP Multitool. It profiles every plugin’s real load cost, finds the slow queries, and trims autoload bloat from one dashboard. It’s a paid plugin — no free-tier games — but it saves me the afternoon I used to spend profiling by hand.
One plugin took the whole site down
223 well-behaved plugins crashed nothing. One plugin did, partway through the climb – it slipped in with an early batch, before my exclusion rules tightened:
PHP Fatal error: Uncaught Error: Call to undefined function
  PersianWooCommerce\Services\wc_get_order_statuses() on init
persian-woocommerce (100k installs) calls a WooCommerce function on init, but never declares Requires Plugins: woocommerce in its header. WooCommerce wasn’t installed. WordPress happily let it activate anyway, and every request returned HTTP 500 – the site stayed down even after I deactivated everything else, until that one plugin was gone.
All of that traces back to one missing line in a plugin header. Remember the header, because it comes back later in a much weirder way.
Can an optimizer plugin rescue it?
The obvious follow-up. The pile is slow – can you install one more plugin that claws the speed back? I tested with WP Multitool 1.3.0. Full disclosure: that’s my own plugin. Which is exactly why I’m comfortable publishing what happened.
First problem: wp-admin was unreachable. The 224-plugin admin bootstrap blows the 256 MB wall before the login page renders. So no optimizer’s admin UI can be opened on precisely the kind of site that needs rescuing – this applies to every optimization plugin, mine included. What saved the phase is that WP Multitool ships wp multitool CLI commands: frontend enable-all, clean, health all ran fine from the terminal, and a short wp eval-file script covered the autoload optimizer (that part only exists as an admin AJAX action so far). Even wp-cli needed php -d memory_limit=512M just to load the site. Without a CLI, this whole phase ends at a dead login screen – keep that in mind when you pick tooling for a site you might one day have to rescue.
What got applied:
- Autoload optimizer: 31 options flipped off autoload, shrinking autoloaded options from 425 KB to 227 KB (-47%)
- All 13 frontend tweaks: defer scripts, strip emoji/dashicons/version strings/jquery-migrate/xmlrpc/oembed
- DB cleanup: 12 expired transients
And the result, A/B measured by restoring database dumps between the two states:
| Metric | 223 plugins | + WP Multitool optimized |
|---|---|---|
| Median warm TTFB | 2.00 s | 2.08 s (within noise) |
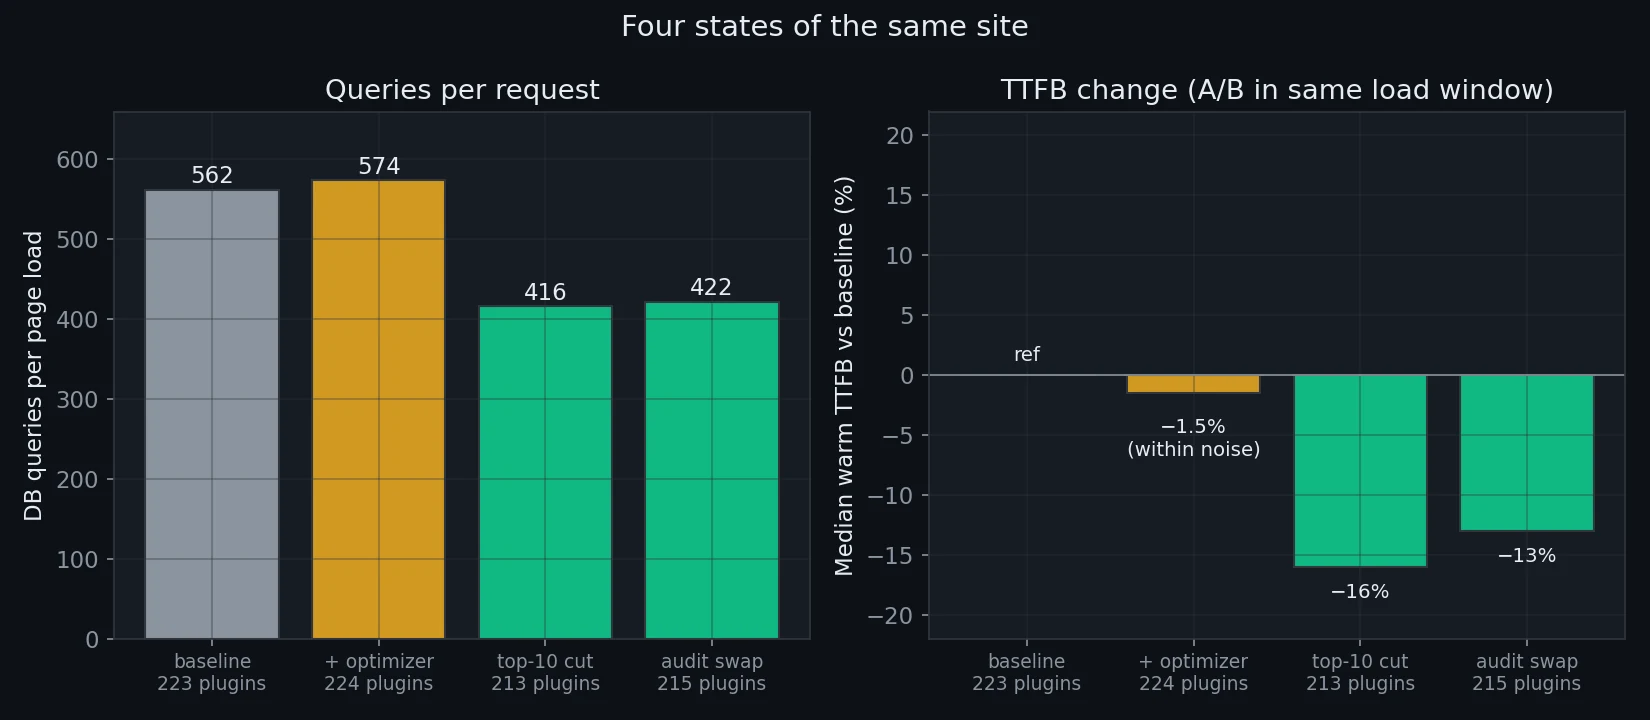
| DB queries / request | 562 | 574 |
| PHP files / request | 5,577 | 5,595 |
| Autoloaded options | 425 KB | 227 KB |
Honest methodology note, because I nearly published a wrong number here. My first quick A/B – two rounds under heavy host load – suggested the optimizer made the site 0.2-0.45s slower, and that almost went into this post. It smelled wrong though: the deterministic counters say it adds 12 queries and 18 files per request, about 2%, and 2% of work shouldn’t show up as 15% of TTFB. So I re-ran it properly: five alternating restore-measure rounds, 120 samples total. The per-round deltas flip sign (+0.19, -0.25, +0.40, -0.03, -0.43s) and the pooled difference is -1.5% median, Mann-Whitney z = 0.74 – statistically nothing. The “slower” reading was an artifact of my noisy 1-core box, and this is why you alternate A/B rounds instead of trusting two measurement windows.
So the real result: no measurable TTFB change in either direction. The autoload cut is genuine (-47%) and would matter on a site where a bloated alloptions row is the actual problem – but this site’s bottleneck is query volume and hook dispatch from 223 plugins, and no plugin can subtract queries that other plugins insist on running. The optimizer’s own footprint (+12 queries, +18 files) is real too, just small enough to disappear into the noise. You can’t plugin your way out of a plugin pile-up – but the right tooling is what let me drive, measure and eventually fix this site at all.
A note on the numbers: each phase re-measured its own warm baseline, which settles a bit lower than the climb-day readings (562 queries vs the ~586 spike, 96 MB vs 102 MB). All comparisons are within the same phase, same load window.
Finding the plugins actually worth firing
If adding software can’t fix it, the next move is subtraction: which of the 223 deserve to go?
I ran a full leave-one-out sweep. For each of the 223 plugins: deactivate it, hit the homepage twice warm, record queries and files per request, reactivate, next. Query counts are deterministic per request, so a single reading ranks reliably even on a noisy single-core box – the measured noise floor was ±3 queries.
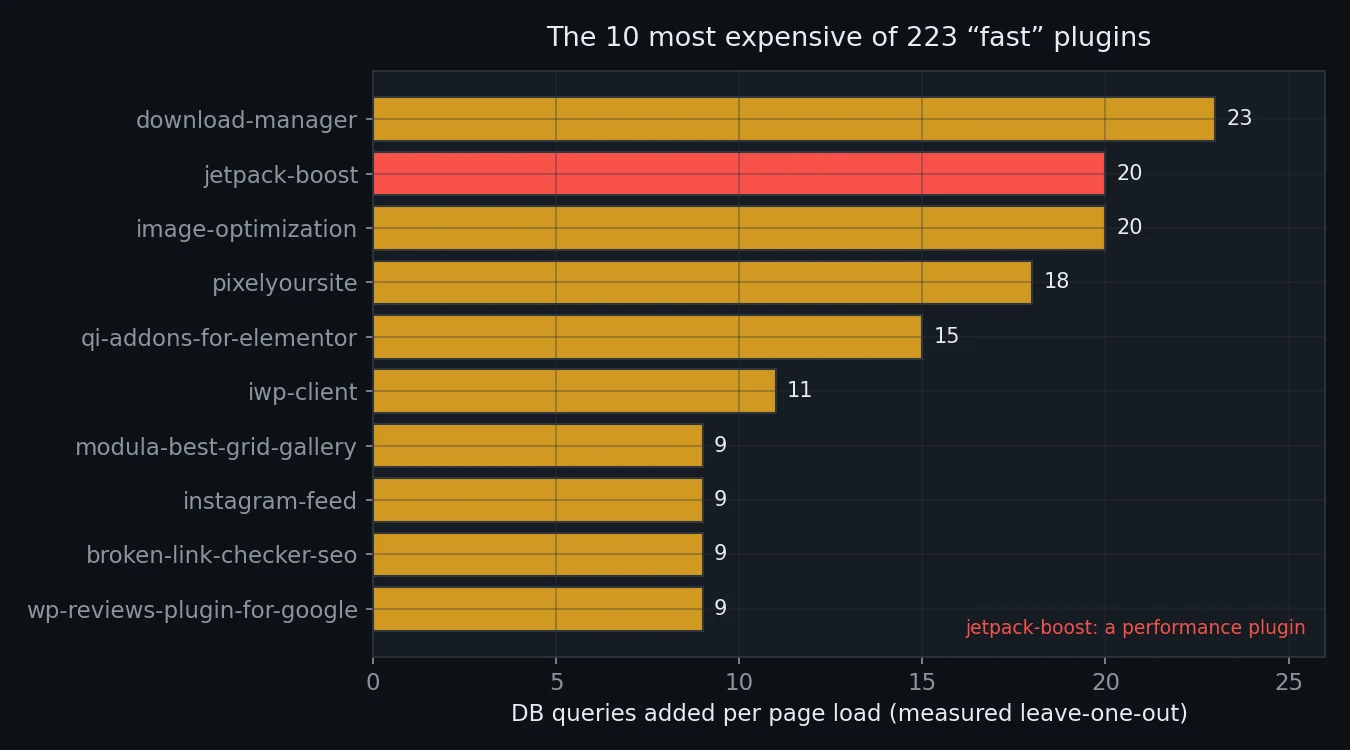
Savor the second row. jetpack-boost – a performance plugin – is the #2 worst offender, spending 20 queries and 157 PHP files on every single request in order to make your site faster. Another image optimizer shows up at #12.
The bigger finding is the shape of the data. The top 10 plugins (4.5% of the pile) account for 143 of the ~537 added queries – 27%. No plugin costs more than 23 queries. And the individual costs sum to ~92% of the total pile cost, so the damage is genuinely additive – no hidden interaction monster, and no single plugin to blame. The cost is spread across the whole pile.
Still, 27% concentrated in 10 plugins is worth money. Deactivating just those 10, A/B measured back-to-back: queries 562 → 416, files down 654, peak RAM down 8.4 MB, median warm TTFB down 16%.
War stories from the sweep
Running 223 deactivate-measure-reactivate cycles on a dying box produced two stories I didn’t expect.
First, the MySQL container got OOM-killed mid-sweep and every wp-cli call started failing with “Error establishing a database connection”. The sweep script had to grow retries, a wait-for-DB loop and resume support. Fine, my fault for running this on a crowded VM.
Second one’s better. WordPress 7’s plugin dependency check turned out to be a one-way door. FiboSearch and 7 other WooCommerce-dependent plugins had been running happily without WooCommerce for the entire experiment – they were activated before anything checked. But the moment my sweep deactivated one, WordPress refused to turn it back on: “requires woocommerce”. Running without its dependency: fine. Reactivating without it: forbidden. I had to write the active_plugins option back directly.
That’s the header paying off. persian-woocommerce skipped Requires Plugins, activated freely and took the site down. FiboSearch declared it, degraded gracefully and survived the whole run – WordPress only got strict with it at reactivation time. Same missing-dependency situation, completely different blast radius.
Replace the villains, keep the features
Deleting 10 plugins is cheating if the site loses 10 features. So the last phase: replace every villain with a functional equivalent picked from the benchmark data, and keep every capability.
| Villain (queries/req) | Replacement (queries/req) |
|---|---|
| download-manager (23) | simple-download-monitor (3) |
| jetpack-boost (20) | nothing – redundant |
| image-optimization (20) | shortpixel-image-optimiser – already installed |
| pixelyoursite (18) | koko-analytics (0) |
| qi-addons-for-elementor (15) | nothing – Elementor isn’t even installed |
| iwp-client (11) | nothing – management runs over SSH |
| modula-best-grid-gallery (9) | foogallery – already installed |
| instagram-feed (9) | insta-gallery – already installed |
| broken-link-checker-seo (9) | nothing – link checking belongs in an external crawler |
| wp-reviews-plugin-for-google (9) | widget-google-reviews – already installed |
Look at how often “already installed” appears. Four of the ten worst plugins duplicated functionality the site already had from a cheaper plugin: a second gallery, a second image optimizer, a second Instagram feed, a second Google-reviews widget. I only had to install two new plugins. Another one, qi-addons-for-elementor, was serving a page builder that didn’t exist on the site – 15 queries per request for nothing.
I’d love to claim I planted those duplicates as a gotcha. I didn’t. They came in naturally with a “fast + popular” selection of 223 plugins, the same way they accumulate on real sites over years of “let’s try this one”.
The result, A/B measured over two rounds in the same load windows:
| Metric | 223 plugins | 215 after audit |
|---|---|---|
| DB queries / request | 562 | 422 (-25%) |
| PHP files / request | 5,576 | 4,952 |
| Peak RAM / request | 88 MB | 82 MB |
| Median warm TTFB | 1.50 s | 1.31 s (-13%) |
Zero capability lost. A quarter of the database queries gone. Double-digit TTFB improvement on a fully uncached site – the -13% is a median across both rounds; individual windows ranged from -4% to -30% on this noisy box, so the query counter is the number I’d defend in court. And half of the fix was deleting things nobody knew were duplicated or dead.
One last jetpack-boost anecdote, free of charge: while switching states for the A/B runs, bulk-reactivating the villains over wp-cli crashed twice at the site’s own 256 MB limit – both times inside jetpack-boost’s activation hook. The performance plugin literally cannot activate within the memory budget of the box it’s supposed to speed up. I had to raise the CLI limit to 512M for it.
What I’d actually do with this
If you run a normal site with 30-80 plugins, the numbers scale down but the shape holds:
- Page caching first. Almost everything measured here is per-render cost. A cache hit skips it entirely. The uncached numbers are your worst case: logged-in users, carts, POST requests, cache misses.
- Audit your plugins individually. 223 cheap plugins ran fine while one bad one killed the site, so the count itself tells you almost nothing. Per-plugin cost is measurable. Measure it.
- Hunt duplicates. 4 of my 10 worst offenders duplicated an existing cheaper plugin. Check your galleries, image optimizers, analytics and social feeds.
- Be suspicious of plugins that promise speed. The only plugin in my top 10 claiming to make the site faster cost 20 queries and 157 files per request – and my own optimizer, honestly measured, couldn’t move TTFB on this site because it fixes a different bottleneck. If a perf plugin can’t show you before/after numbers on your site, assume nothing.
- Check for
Requires Pluginsbefore you trust a dependency-shaped plugin. Plugins that declare their dependencies fail politely. The ones that don’t can take your whole site down with them. - Pick tools with a CLI. When the pile finally kills wp-admin, the terminal is the only door left. Every fix in this post ran over wp-cli.
The per-plugin costs I used to pick replacements come from benchmarking 54,000+ wordpress.org plugins across activation, homepage and admin contexts – that dataset is available as an API if you want to audit your own stack against it.
The pile-up site is still running, by the way. 223 plugins active, homepage still HTTP 200. I’m weirdly proud of it.
Join developers and agency owners who get backend optimization strategies, tool releases, and deep-dive guides.
No spam. Unsubscribe anytime. I respect your privacy.